Consumer prototype first drive!

 CBS Detroit 

Edison2 Unveils New Super-MPG Car At The Henry Ford

DEARBORN — Finally, a 21st Century car that really looks like it came from the 21st Century.

The venue was appropriate. The Henry Ford is a shrine to American innovation, and the Edison2 is packed with innovation from stem to stern.

Thursday
Oct282010

What a Difference a Year Makes

In late October 2009, Edison2 set off to Las Vegas for the SEMA Show with the first life-size Very Light Car. The unpainted, windowless and doorless shell was the first trial piece out of our mold and it was mounted on a real but bare frame fitted with dummy suspension. Here’s a photo of that mockup car on the X Prize stand at the show.

Our cars first ran in actual competition at Michigan International Speedway only 26 weeks later. In the meantime, our team had built, assembled and tested the real bodywork, the special engine and transmission, the entire electrical system and our unique patent pending suspension. Not to mention the seats, the handbrake, the steering assembly, the door latches and many, many more parts, assemblies and systems.

Thirteen short weeks after that, Edison2 had survived 3 extremely grueling rounds of X-Prize competition at MIS and successfully completed all the X Prize competition requirements. After holding our breath for what seemed forever, and only 322 days after the Very Light Car mockup appeared at SEMA, Edison2 and the #98 were presented in Washington DC with the X Prize Winner’s trophy.

One year later, Edison2 sets off once again to Nevada but this time with the #98 X-Prize winning car.

We wonder what we’ll find there. Competitions can be ruthless but in the end they are honest. The honesty that emerged was that light weight and low drag really are the only absolute virtues. Another truth is that of many X-Prize contenders in Las Vegas last year, few survived the Finals. And the world’s problems have not gone away in the last 12 months. We all still face difficult times and enormous economic uncertainty and the right path forwards is still emerging. We think we’re part of that path.

At SEMA we will discuss our car and the ideas behind it to any and all interested people. Back in the shop, the rest of us are working just as hard as this time a year ago on the new Version 4 Very Light Car. If this work seems to take a long time, please remember what our group has achieved in the last 12 months and then imagine with what we know now what we can do in the near future. We hope you’ll come along for the ride.


Monday
Oct252010

Chasing the Numbers

Edison2 made all our primary decisions on how to approach building a truly efficient car right at the beginning of our X-Prize campaign. Time has proved to be on our side here and we’re pleased that our initial analysis has turned out to be so watertight.

What has happened as time has gone by is that we have learned where to look to find other people’s numbers and what we find there gives us a chance to further explore our ideas.

The engineering department at Edison2 avoids the fashionable idea of simulation but we do spend a bit of time writing models because in our models we find clarity. Consider the graph below:

We’ll talk about the three straight lines first. These are iso-efficiency lines that give the amount of power available for different speeds at 100 mpge. Since a gallon of gas has 115,400 BTU of energy, the faster you can go while getting 100 mpge, the more power you have; in other words, you’ve got so much energy to go 100 miles so, the faster you can go and still make it to 100 miles, the faster you can spend that energy.

This is cool because if your car is as efficient as the Very Light Car, you have more power to spend than if you drive some obsolete barge.

To get back to the graph, the three straight shades of light blue lines tell how fast you can go at different levels of energy efficiency and still get 100 mpge. The top straight line is 100% efficiency, the middle 60% and the bottom 20%.

The graph’s curved lines are derived from published ABC coastdown data for the 2010 Escalade, Camry and Very Light Car. Where the curved and straight lines cross is how fast that car will go at that efficiency and still get 100 mpge.

Some interesting stuff comes out of this. First, both the Escalade and Camry take a large energy multiple of the Very Light Car to move down the road. Second, the Escalade power used line crosses the 100% efficiency line at slightly less than 60 mph while the VLC crosses the 20% efficiency line at slightly over; 20% would be a really bad IC engine efficiency, and even with that, the VLC is better than an Escalade with an obviously impossibly efficient power plant.

Interpolating between the lines, a realistic electric drivetrain efficiency is 80% and a very good IC might deliver 30%. Assuming an electric Escalade and Camry and an IC VLC, Edison2’s car will go twice as fast as the Escalade and about 50% faster than the Camry at 100 mpge.

Were we to project the lines above 100 mph, we would see the VLC line cross 100 % efficiency at about 187 mph. We wish that 100% efficiency was achievable: it is not.

The first thing to come out of this is that GM never had the mystical 300 mpg carburetor because it is literally impossible to get more than about 58 mpg out of an Escalade at highway speeds. The second is that at 30% efficiency, the Very Light Car has demonstrated it can deliver 100 mpge at 80 mph. An electric VLC would be even better in terms of efficiency and, depending on the choices made in its execution, could cure electric car range anxiety.

The bottom line? It is the car that matters: an enormous, square behemoth drinks energy while a light, low drag VLC does not. What you power them with also makes a difference but electric drive does not fix any underlying inefficiency in the car

Wednesday
Oct132010

And The Consequences Are

At Edison2 we try very hard to talk facts and only facts. For us, the numbers the Very Light Car made in coastdown testing both confirmed what we had hoped and opened some new vistas.

We’ve discussed the meaning of ABC coastdown numbers in previous blog posts; now let’s talk about the consequences.

By definition, a horsepower is 33000 ft.lb/min; it’s the work that a good horse could reliably deliver when, say, lifting coal out of a mine. A fit man can expend about a horsepower for short bursts: for example, a 200 lb man running up a 10 ft flight of stairs in 3 seconds (200 x 10 x (60/3) = 40000 ft.lb/min = 1.2 hp).

The beauty of ABC coastdown numbers is that we can calculate the overall drag for any given speed. From there we can then calculate the power required to drive the car and the energy needed to cover a given distance.

Consider the spreadsheet below. Based on our coastdown ABC numbers, this tabulates the power required for the VLC to run on a level road at a range of speeds.

VERY LIGHT CAR


A

B

C


EFFICIENCY (%)

BATTERY KWhr

6.31

0.1862

0.00433


84

16


SPEED

DRAG

POWER

ENERGY

RANGE

mph

lb

hp

KW

KWhr/100 Miles

Miles


0

1.4

0.0

0.00


10

8.6

0.2

0.17

2.04

785

20

11.8

0.6

0.47

2.79

574

30

15.8

1.3

0.94

3.74

428

40

20.7

2.2

1.65

4.90

327

50

26.4

3.5

2.63

6.26

255

60

33.1

5.3

3.95

7.83

204

70

40.6

7.6

5.65

9.61

167

80

48.9

10.4

7.78

11.58

138

90

58.1

14.0

10.41

13.77

116

100

68.2

18.2

13.57

16.16

99

The power numbers are really quite astonishing – only 3.5 hp to drive the VLC at 50 mph. The great virtue of such a low power requirement is that energy requirements are also spectacularly low. Using our platform, the range of an electric car stops being a problem.

In the table, for a given speed in the left column, the ABC numbers are used to calculate overall vehicle drag in pounds; knowing drag and speed, we can calculate power in horsepower and kilowatts (1 hp = 0.746 KW). Knowing the power requirement in KW and speed allows us to calculate energy use per 100 miles. For example, at 50 mph, it would take 2 hours to drive 100 miles, so the energy required is 2 hours x 2.63 KW = 5.26 KWH.

Where this gets interesting is the Range column. The numbers here are calculated from energy use and battery size and efficiency. Here we’ve used 16 KWH for the battery size (like the Chevy Volt) and, based on our research and some very competent advice, assumed 84% for overall efficiency for the battery, controller and motor.

It is significant how this works out: 204 mile range at 60 mph reminds us why we chost an internal combustion engine for the X Prize. For the competition we needed to (and easily did) demonstrate a 200 mile range with our Mainstream cars, and 204 miles with a battery cuts it far too close. We could have fitted a larger battery, but the extra weight would decrease overall efficiency.

The numbers don’t lie and wishful thinking doesn’t cut much ice with physics. So the consequences are, if you want an electric car with realistic range it’s going to need to look pretty much like the Very Light Car. If it looks like an ordinary car, it’s not going to go very far before it needs recharging.


Tuesday
Aug312010

More About Coastdown Testing

The engineering department at Edison2 greatly appreciates the informed comments and gentle prodding we get on the Blog page. We have and will continue to do our best to put actual information up here. We hope everyone will realize that we also have our jobs to do so sometimes it might be a while to answer even really good questions.

We didn’t have stopwatch on it but it seemed to take only about 5 minutes before Kevin pointed out that the C term in our last blog post didn’t make a lot of sense. He’s absolutely right, it doesn’t, and the reason for that is also the reason that the car industry needs coastdown testing and does not just rely on wind tunnel numbers.

The SAE standard that defines coastdown testing is J2263. It’s available for download from multiple places online but because it’s copyright material you have to have to pay for it. It’s an interesting read if you’re into this kind of thing (and a great cure for insomnia if you’re not) and it delves into some of the complexities that surround this. For example, how do you account for rotating weight? A wheel not only has linear inertia because it’s travelling but it also has rotating inertia because it rotates. J2263 discusses this at length and in detail.

Whether or not stuff like rotating inertia is significant depends on the numbers you’re trying to find. If all you really want to know is how much drag there is at any given speed, the coastdown method is great. Plot speed against acceleration (and, since mass is constant, acceleration gives you force) from the coastdown and you have the drag profile. It happens that car drag profiles very reliably fit the A + Bx + Cx^2 three term general form.

Here’s a parallel: if you want to know downforce, do you take a bunch of pressure taps and attempt to integrate the pressure contours you generate over the car’s planform area? You could but it’s kind of messy. Far better to measure the downforce directly because that intrinsically integrates the air pressure over the whole body.

So what happens is, the coastdown people do a curve fit on the speed/drag plot and that gives  the A, B and C numbers and all the complexities are handled right there. While the C number, being squared, sort of corresponds to aero, it doesn’t necessarily do so exactly. It’s just like saying we don’t care very much what our pressure distributions are because we know accurately how much downforce we have.

That said, we at Edison2 like to be sure of our ground as much as the next person so we asked the coastdown engineers to dive into the sea of numbers and calculate our Cd given our 1.702 m^2 (18.3 ft^2) frontal area. These guys are good at this and proved it when the number they delivered, 0.157, agrees within 2% the number we saw in the wind tunnel.

It’s an interesting factoid that the Very Light Car rolled about 8100ft (over 1½ miles) while coasting down from about 71 to 10 mph (the standard is actually from 115 to 15 km/h). If we were to assume linear speed decay, the force to decelerate would be about 20.4lb. This matches the ABC coastdown numbers at a little over 40mph, right in the middle of the speed range. Overall, we’re happy that we’re dealing with facts.

And if you really want to see how good the VLC is, take your own road car up to a bit over 70 on a level road, knock it into neutral and see how far it goes. Even though it weighs some multiple of the VLC, bet it’s less than 1.5 miles. Please use common sense and do this only where it’s safe and legal.

Edison2’s engineering department goes to a lot of trouble to model performance, which is why we were able to make some very good primary decisions about our cars’ layout and characteristics. But we’ve also learned a hard lesson over the years: there comes a point where you just have to go out and try it. When what you observe in reality doesn’t line up with the model, the reasons why are worth study.

Wednesday
Aug252010

About Coastdown Testing

The engineering department at Edison2 is pleased about the informed and civilized discussion on car efficiency that we see on our blog. A constant strand in the discussion is: where does the crossover come between rolling resistance and aero drag?

The procedure used by the automotive industry to determine resistance to motion is the coastdown. There’s an SAE standard for how to do this but, broadly, the car is either driven, pushed or pulled up to a certain speed, usually a little over 70mph, after which it is put into neutral (or released) and coasts until the speed drops below 10mph. Speed and distance during this are recorded very accurately by special purpose instrumentation. Some checks and balances are applied to make sure the results are good: it’s done multiple times in both directions on a straight road to make sure the data is consistent and to cancel out the effects of wind and gradient. Analysis of the recorded speed and distance information yields the car’s drag “fingerprint”.

Although it’s obvious that the car’s speed will decay as it coasts, this does not happen at a constant rate because of multiple different components of the total resistance to motion. The drag that causes the car to slow down fits very precisely an equation of the form

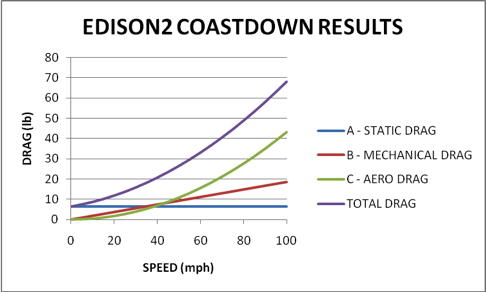
In the equation, drag is in pounds and x is speed in miles per hour. The equation’s A term is a constant value representing static drag: it takes this much to make the car move at all and this drag is always present regardless of the car’s speed. The B term changes linearly with speed and is best thought of as mechanical drag, such as bearing friction. The C term is aero drag and it varies with the square of speed.

Thousands of these tests have been carried out over the years and there is vast accumulated experience showing that a car’s total resistance to motion very closely follows the simple three term equation. In fact, this method and analysis are so well accepted that A, B and C numbers for many current cars are available on the epa.gov website.

The Very Light Car’s A, B and C numbers are 6.31, 0.1862 and 0.00433 respectively. Plotted on a graph against speed, they look like this:

Inspection shows the static drag figure dominates at low speed. Static drag is in large part due to tire deflection caused by car weight and consequently the Very Light Car does extremely well. From numbers Edison2 obtained from the EPA, the corresponding figure for a 2 wheel drive Escalade is 33.61, more than 6 times as much.

The B value, mechanical drag, is similarly low because of the very careful attention we gave the VLC’s mechanical design. The corresponding Escalade figure is 1.0442, more than 5 times as much as ours.

Aero drag (the C term) becomes important above about 40mph and above about 70 it is higher than static and rolling drag combined. That this only happens at such a high speed is testament to the extremely slippery shape devised by Barnaby Wainfan.

It’s interesting that at about 40 mph, static, mechanical and aero drag are close to equal. Even with our particularly light and efficient car, if aero drag were zero, at 40mph there would only be about a 30% reduction in power required and therefore fuel consumption. Low aero drag is important, of course, but so is mechanical efficiency. The VLC has them all.

We would like to emphasize that these numbers are not guesses, estimates, projections or simulations. They are measurements taken in accordance with a recognized SAE standard by experienced and competent people. Edison2 was told by the test facility (Chrysler Proving Grounds, Chelsea, MI) these are the best numbers they have ever seen, by far.

In these measurements are the key to getting acceptable range from an electric car. We’ll be writing more about that in a future post.


Page 1 ... 5 6 7 8 9 ... 17 Next 5 Entries »