The engineering department at Edison2 is pleased about the informed and civilized discussion on car efficiency that we see on our blog. A constant strand in the discussion is: where does the crossover come between rolling resistance and aero drag?
The procedure used by the automotive industry to determine resistance to motion is the coastdown. There’s an SAE standard for how to do this but, broadly, the car is either driven, pushed or pulled up to a certain speed, usually a little over 70mph, after which it is put into neutral (or released) and coasts until the speed drops below 10mph. Speed and distance during this are recorded very accurately by special purpose instrumentation. Some checks and balances are applied to make sure the results are good: it’s done multiple times in both directions on a straight road to make sure the data is consistent and to cancel out the effects of wind and gradient. Analysis of the recorded speed and distance information yields the car’s drag “fingerprint”.
Although it’s obvious that the car’s speed will decay as it coasts, this does not happen at a constant rate because of multiple different components of the total resistance to motion. The drag that causes the car to slow down fits very precisely an equation of the form
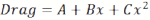
In the equation, drag is in pounds and x is speed in miles per hour. The equation’s A term is a constant value representing static drag: it takes this much to make the car move at all and this drag is always present regardless of the car’s speed. The B term changes linearly with speed and is best thought of as mechanical drag, such as bearing friction. The C term is aero drag and it varies with the square of speed.
Thousands of these tests have been carried out over the years and there is vast accumulated experience showing that a car’s total resistance to motion very closely follows the simple three term equation. In fact, this method and analysis are so well accepted that A, B and C numbers for many current cars are available on the epa.gov website.
The Very Light Car’s A, B and C numbers are 6.31, 0.1862 and 0.00433 respectively. Plotted on a graph against speed, they look like this:
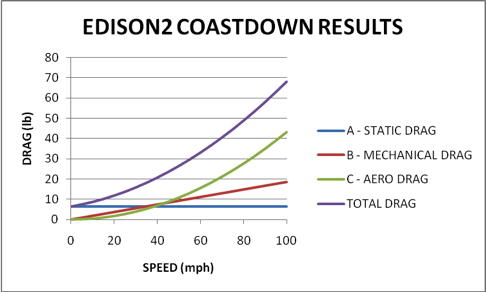
Inspection shows the static drag figure dominates at low speed. Static drag is in large part due to tire deflection caused by car weight and consequently the Very Light Car does extremely well. From numbers Edison2 obtained from the EPA, the corresponding figure for a 2 wheel drive Escalade is 33.61, more than 6 times as much.
The B value, mechanical drag, is similarly low because of the very careful attention we gave the VLC’s mechanical design. The corresponding Escalade figure is 1.0442, more than 5 times as much as ours.
Aero drag (the C term) becomes important above about 40mph and above about 70 it is higher than static and rolling drag combined. That this only happens at such a high speed is testament to the extremely slippery shape devised by Barnaby Wainfan.
It’s interesting that at about 40 mph, static, mechanical and aero drag are close to equal. Even with our particularly light and efficient car, if aero drag were zero, at 40mph there would only be about a 30% reduction in power required and therefore fuel consumption. Low aero drag is important, of course, but so is mechanical efficiency. The VLC has them all.
We would like to emphasize that these numbers are not guesses, estimates, projections or simulations. They are measurements taken in accordance with a recognized SAE standard by experienced and competent people. Edison2 was told by the test facility (Chrysler Proving Grounds, Chelsea, MI) these are the best numbers they have ever seen, by far.
In these measurements are the key to getting acceptable range from an electric car. We’ll be writing more about that in a future post.