Consumer prototype first drive!

 CBS Detroit 

Edison2 Unveils New Super-MPG Car At The Henry Ford

DEARBORN — Finally, a 21st Century car that really looks like it came from the 21st Century.

The venue was appropriate. The Henry Ford is a shrine to American innovation, and the Edison2 is packed with innovation from stem to stern.

Friday
Aug262011

MPGe and the Confusing World of Auto Efficiency

A problem in today’s world of automobiles is how to fairly compare the efficiency of vehicles with differing types of engines and fuels. One solution is Miles per Gallon Energy Equivalent (MPGe), used by the X Prize for their automotive competition and by the EPA to rate electric vehicles and plug-in hybrids. MPGe is a useful standard: for example, it brought the Nissan Leaf’s initial claim of 367 MPG down to a more realistic 99 MPGe.

MPGe compares the energy content of various fuels to that contained in a gallon of gasoline: approximately 115,400 BTUs, as shown in the following table:

BTU                   FUEL                 QTY            UNIT

115,400            Gasoline            1.000            US Gallon

115,400            E85                   1.414            US Gallon

115,400            Diesel                0.899            US Gallon

115,400            Electricity           33.7              kWh

Edison2 chose to run our X Prize cars on E85 for technical reasons, and because of the MPGe metric there was no penalty for the fuel’s inherently low energy content, just as there was no advantage for someone running a higher energy content fuel like diesel. It’s the energy content of the fuel compared with a gallon of gas that’s at stake, not the volume.

The bottom line is that a gallon of gas has the same energy content as about 1.4 gallons of E85 or 0.9 gallons of diesel. How far you go on this quantity of any of these fuels is your MPGe figure. Here’s how this works out:

FUEL                 MPGe                      MPG                       Gallons / 100 miles

Gasoline            100                        100                        1.000

E85                   100                        70.7                       1.414

Diesel                100                        111.2                     0.899

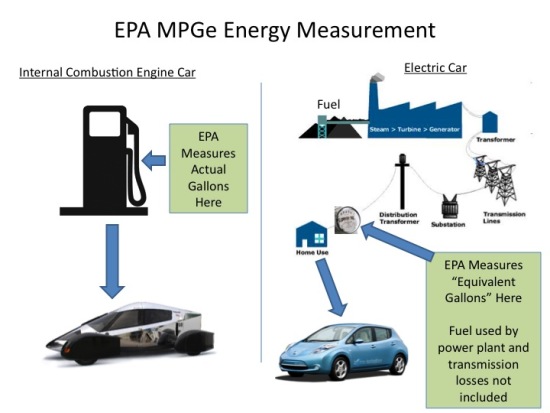
With electricity the process is similar. Fully charge the battery pack, run the car, and measure with a calibrated meter the electricity needed to fully recharge. This method – “plug to wheels” – was used by the X Prize and is used by the EPA.

But some people, including those of us at Edison2, see a problem with the “plug to wheels” metric: it fails to take into account generation and transmission losses associated with electricity. For example, in 2004 6.4% of the electricity generated in the US was “lost” in transmission and distribution (this figure is higher in many countries, such as 15.8% in Mexico), and half or more of the energy generated at a coal-powered electric plant is lost as heat. Thermal conversion in an internal combustion engine, of course, occurs under the hood, but a plug-to-wheels accounting for EVs does not consider energy generation.


But there are metrics that look at the bigger picture of efficiency and measure vehicles “well to wheels”. Argonne National Lab’s GREET model (Greenhouse gases, Regulated Emissions and Energy use in Transportation) looks at the upstream efficiency of fuel sources  – such as transmission and generation losses – and was used by the X Prize in calculating emissions. Likewise the CAFE standards for emissions will gradually factor in the upstream emissions.

But these issues with MPGe are only the tip of the iceberg when it comes to confusing or even misleading claims for MPG, due in part to the differences world-wide in assessing efficiency. As an example, VW made headlines this year with their 313 MPG diesel plug-in hybrid XL1 concept. However, this admittedly very efficient two-seater is rated using imperial gallons, which are 25% larger than US gallons, on the European NEDC testing cycle, which does not take into account the energy stored in the car’s 5 kWh battery. Considering these factors, and the higher energy content of diesel, the XL1 gets in the neighborhood of 106 MPGe (but because NEDC is a different drive cycle than the stricter EPA cycle an accurate comparison is really not possible).

MPGe may not be perfect, but it is a good and reasonably fair place to start in comparing automobile efficiency. Adding in upstream energy losses – for all fuels – would make it even better.

Friday
Aug052011

Virginia Tech Wind Tunnel

A couple of hours away from our Lynchburg shop is Virginia Polytechnic Institute and State University and their Stability Wind Tunnel. Acquired from NACA Langley (National Advisory Committee for Aeronautics, the precursor to NASA) in 1958, Virginia Tech’s six-foot tunnel is one of the largest university operated wind tunnels in the United States with very good flow quality and maximum speeds of 80m/s.

Which works well for our quarter-size models of the next version VLC. We mounted our models (testing a total of 4 different next-generation models) on a ground board that we constructed; the tunnel is meant for testing planes, not cars, so we needed to simulate the road with our ground plane.

First we tested a model of our X Prize car, as a control, and were very pleased to see that the drag was close to that tested on the #95 car at the GM Aero Lab. We were even more pleased when our models 2 & 3, roomier and designed with an eye towards regulatory compliance, were just as slippery as the X Prize car.

We learned a lot from these tests. We attached yarn tufts to be able to visualize airflow, and using tape and clay evaluated the impacts of various surface features and details (such as mirrors, shut lines, and wiper recesses). We have good information for the next iteration and know we can do better.

But as good as this tunnel is, there are limitations that occur with quarter scale models. The characteristics of airflow (Reynold’s numbers) are a function of both air speed and object length (among other factors), and we were not able to run the tunnel at 4x normal air speed to get full-scale Reynold’s number. We are looking for comparative results, not absolute values, both in how our new shapes stack up with the X Prize car and how the new shapes differ from one other.

Specific results come from a full-size car in a much larger tunnel. Stay tuned.

Wednesday
Jul202011

The Limits of the Possible

We have been hinting for quite a while about an electric version of our Very Light Car, and how superb platform efficiency could solve electric car issues of range, battery weight and battery cost. We now have an electric prototype and last week spent a day at the North Carolina Center for Automotive Research (NCCAR) in Garysburg, NC, doing some initial testing. We are quite excited about the results and hope you will be too.

We emphasize that this is initial testing. These are own measurements, using our own equipment; we’ve checked them very thoroughly against each other and against our large and growing efficiency and performance database, and they are consistent and in line with our expectations. But until we’ve checked them with a certified test in an EPA approved lab, they’re provisional.

Edison2’s 4-seat electric car ran 45 laps of a 2.03 mile track in 2 hours, 6 minutes and 42 seconds. After this, our meter upstream of the charger showed it took 9.89 kWh to recharge. The empty car weighed 1031lb.

We are just listing our results and refraining from making any claims about this performance for a number of reasons. Although we ran the track in both directions, we’re not certain of the effect of the wind, or the impact of the approximately 1400 degrees of corners in each lap at NCCAR (but our calculations show the corners cost us about 13%).

But a big reason is that there are just too many unsubstantiated or misleading assertions about efficiency in today’s automotive world. The Nissan leaf advertised 367 MPG before the EPA tested the car and found a much more modest 99 MPGe. The VW diesel hybrid XL1 concept is rated at 313 MPG – but it turns out that is imperial gallons, which translates to 260 MPG US, but more importantly is calculated using NEDC (New European Driving Cycle) methodology, which does not take into account the energy from the battery; including the battery brings this down to 118 MPG (US) or 101.6 MPGe.

So soon we’ll be in the emissions lab, not to measure emissions but because that’s where the EPA measures the energy consumption reflected in MPG and MPGe on a new car’s window sticker. Labs are windless places and the tests are run in a straight line. We’ll let you know how we do.


Monday
Jun272011

Siemens' Solid Edge ST4 Launch

Edison2 recently had the distinct privilege of delivering the keynote address at Siemens’ Solid Edge ST4 CAD software launch event. Our Director of Research and Development Brad Jaeger spoke to an audience of over 400 engineers and scientists about our experience and success with designing in Solid Edge, and our hopes and plans going forwards.

Most people reading this know that Edison2 is a startup high efficiency car company while Siemens has over 400,000 employees across the globe, making them nearly twice the size of GM. We have written in this blog previously about the warm reception Edison2 has received at GM, particularly by their aerodynamic and wind tunnel people, and we were truly flattered by the amount of goodwill we received last week from Siemens Solid Edge. Small company and very large company: what is the key to such a relationship?

In our view, just like any good relationship, it’s based on respect for each other’s strengths. Edison2 cannot pretend to have the might or depth of resources of Siemens or GM but our scale means we are naturally lighter on our feet. Combined, we’re like Muhammad Ali: we float like a butterfly and sting like a bee.

The path to turning Edison2 from a competition team into a technology company has been interesting and enlightening. To get our ideas and methods into the marketplace will take powerful friends. GM and Siemens have stepped up and helped us, as are others we cannot yet name.

It’s our experience that the people of large corporations are smart, hard working and want to do the right thing just as much as we do. That’s why they’re helping us and that’s why we’re doing our best to work with them. It’s no use just wishing for change, you have to work for it and you have to get the resources in place to make it happen.

Edison2 has a lot of work to do to move our proof-of-concept prototypes towards production. Solid Edge ST3 has been a great tool for us and ST4 is an even better one. With friends like Siemens – and GM – our path is smoother and our journey is faster.

Thursday
May262011

The Charge Time Metric

Maybe there is room for another way of comparing electric cars.

We liked the format of the X-Prize competition because competitions are inherently fair: cars ran in the same conditions and energy consumption was measured by a clear metric, MPGe, so there was no cherry-picking numbers or conditions. For example, the efficiency events were run on a closed track without altitude gain or loss, and the energy used was very carefully measured by competent and impartial judges. Under MPGe the energy consumed by vehicles with diesel, ethanol, electric or hybrid drives is referenced to the energy contained in a gallon of gasoline.

But the problem with MPGe is that you have to explain it all the time. For all the X Prize Foundation’s efforts, and the EPA’s, and the Department of Energy’s (they all use and promote the MPGe metric) it’s just not that easy to understand.

But the other day Edison2’s engineering staff were asked a sensible question about our new electric model: how long does it take to charge? Our short answer was, “quickly enough to be acceptable and viable for most people” and, as you would expect, there was a longer answer as well. Real-life charging time depends on how far you go and how fast you go. Of course that’s true of all cars but it’s energy not spent on pushing a heavy car with ordinary aerodynamics that really counts. So, as we like to do, we ran the numbers.

Some of our early blog posts explained our coastdown figures, which are derived using a recognized SAE standard and measure total resistance to motion caused by aerodynamic drag, rolling resistance and mechanical losses. The VLC’s coastdown numbers are the best ever for a 4-seat car and therefore our energy consumption, regardless of energy source, is also the lowest ever.

That’s a bold statement but the problem lies in getting its significance out in an easy-to-understand way. How about how long to recharge after driving a certain distance and speed?

Our performance projections for our electric VLC model take into account a little higher rolling resistance than the X-Prize competition cars (because the batteries make it heavier) and allow for 84% total efficiency through the charger, batteries and electric motor, a figure we think is realistic. On that basis, the electric VLC will take slightly under 4 hours 30 minutes to recharge from a standard 110 Volt 15 Amp socket after a 100 mile run at 70 mph.

To put that in perspective, neither the Nissan Leaf nor the Chevy Volt can actually go 100 miles at 70 mph before their batteries go flat. In fact, the EPA rates the Leaf at a 73 mile range and Nissan concedes it takes 20 hours to recharge from a 110 V socket. Also according to the EPA, the Chevy Volt will go 35 miles on its battery and Chevy says it will then take 10 hours to recharge.

So, 100 miles for 4 ½ hours of charging, 73 miles for 20 hours or 35 miles for 10 hours. You make the call.