One of the cool things we get with official EPA test results for our electric car is instantaneous voltage and current draw readings. Since the eVLC runs on DC electricity, it’s simple to calculate power: it’s voltage multiplied by current.
Suppose at some point on the test the car draws 53 Amps at 107 Volts, the power is 53 x 107 = 5671 Watts or 5.671 kW. There’s a direct conversion from this to horsepower: 1 hp = 0.746 kW so in our example we’re using 5.671/0.746 = 7.6 horsepower.
The voltage and current readings taken by the lab allow us to plot the power consumption in different ways and study and learn from the results. Consider the graph below which plots power against speed for the FTP75 EPA City test
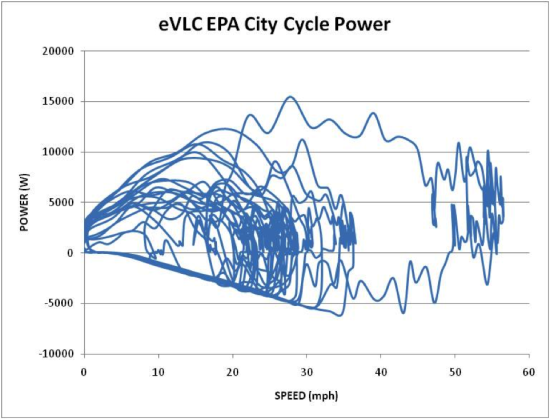
Speed in miles per hour is on the X-axis and Power in Watts is on the Y-axis. Inspection tells us lots of things. For example, the maximum speed of the test is about 56 mph, second, the maximum power required is just over 15 kW (about 20 horsepower), the majority of the test is run below 40 mph and, because the power is sometimes negative, we are using regenerative braking (regen).
On closer inspection it gets more interesting. The City cycle involves 23 stops and starts and each launch is reflected by its own loop in the power/speed trace. There is only one excursion above about 36 mph and the power required to accelerate the car is much greater than that required to maintain it in the cruise portion at about 50 to 55 mph.
Where it gets really interesting for an engineer is the convergence to a sloping line beneath zero power, meaning it’s to do with our regenerative braking. That this is a straight line indicates there is a torque limit to our regen: our relatively simple controller has a limit on how much it can cull from the motor and put back in the battery while the car is slowing.
Could we improve the regen and thereby make our numbers even better? That’s where the art comes in. Consider the graph below which is of exactly the same data as the first chart but with the measurements presented as points rather than a line.
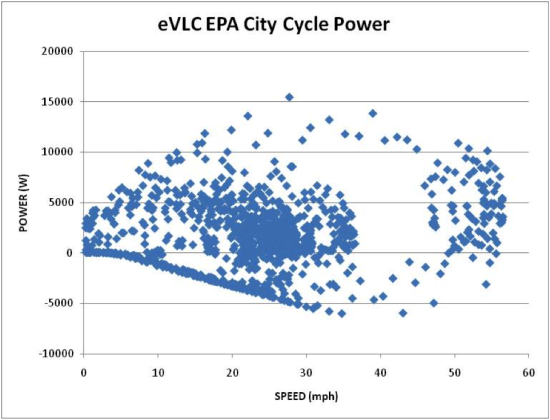
Inspection shows us something interesting that’s not obvious in the smoothed line format – there are many more data points above zero power than below. Since the data points are taken at even time intervals, it becomes clear that even on the City cycle where you’re stopping and starting all the time, it’s how much energy you spend that dominates, not how much you recover through regenerative braking.
This has a number of profound implications for the design of the car, which have been a theme through everything Edison2 does - and you’ll see this if you read back through the various papers we’ve presented on this blog.
First, let’s consider whether we could do better if we had a better motor/regen controller, one that allowed us to recover the energy that might be available below and to the left of the present torque limit. The answer is, we could, but at what price? Right now we’re using inexpensive, off-the-shelf components and we’ve put up the best official EPA test numbers ever, by far. One of the core points we make at Edison2 is that we have superb performance with here-and-now technology. If we had a gold-plated, mil-spec controller we could do a bit better still but you’d have to be rich to afford it.
Second, the relative lack of points below zero power indicate that you can’t make great numbers, even with best in the world regen, if you’re spending energy like crazy to move a heavy square box along the road. The secret is to not spend it in the first place and that’s what the Very Light Car is all about
Third, regen has consequences. Most electric cars are front wheel drive because, since that’s where the weight goes when the car brakes, that’s where you can recover the most power. Front wheel drive has the disadvantage that the driving wheels must also steer so you have to move the power through articulating couplings in the driveshafts. This causes mechanical drag and it puts extra parts in the airflow, causing aerodynamic drag. At Edsion2 we realized the car spends much more time being driven than slowing so we deliberately chose rear wheel drive because we could package everything better for aerodynamics and it’s mechanically more efficient.
So, once again, testing by an impartial lab to a recognized standard has produced results that demonstrate the fundamental correctness of our methods and approach. We know we are on the right path and the results confirm it.